HIGH MARKS: County schools’ performance scores announced
Published 9:47 pm Tuesday, February 10, 2015

BEAUFORT COUNTY EARLY COLLEGE HIGH SCHOOL
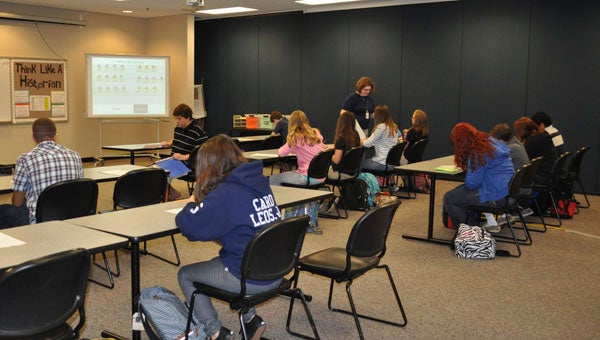
AND THE RESULTS ARE IN: North Carolina’s first School Performance Grades for the 2013-2014 school year were released last week and over half of the schools in Beaufort County finished with a C or better. Beaufort County Early College High School received the only A in the county. Pictured, students in Amanda Smith’s class at BCECHS receive instruction and complete assignments.
North Carolina’s first School Performance Grades for the 2013-2014 school year were released last week and over half of the schools in Beaufort County received a “C” or better.
Beaufort County Schools received grades for 12 out of 14 schools, according to a BCS press release. Among those, one school received an overall score of an A: Beaufort County Early College High School; Bath Elementary and Chocowinity Primary School both received a B; Northeast Elementary School, Northside High School, Southside High School and Washington High School received a C; and Chocowinity Middle School, John Cotten Tayloe Elementary School, John Small Elementary School, P.S. Jones Middle School and S.W. Snowden Elementary School received a D. No schools in the county received an overall grade of F, and two schools in the county — Eastern Elementary, which is Kindergarten through first-grade and Beaufort County Ed Tech — are not rated in this manner, according to the release.
Dr. Don Phipps, superintendent of BCS, said the performance grades are just one of many indicators that aid the system in highlighting the strengths and weaknesses of individual schools. He also commented on BCECHS receiving the only A in the county. Among about 76 early college high schools across the state, BCECHS was one of many to receive an A for its grade, according to the Department of Public Instruction.
“I think, in some areas, we did better (than other schools) and, in some areas, poorer, and we have to look at the overall performance,” Phipps said. “Schools vary so much from one to another. This is just one indicator, and we use it in conjunction with all other indicators. It helps us highlight what we need to celebrate as accomplishments and what we need to look at as challenges. I think it’s a true reflection of what’s going on at (BCECHS). It lines up with other indicators, and it’s just more verification of the great performance of students and teachers in that school. I think it’s an accurate reflection.”
Across the state, 65.4 percent of elementary and middle schools earned a grade of C or better. For high schools, which have additional indicators of career and college readiness included in their grade, 88.8 percent earned a grade of C or better. In addition, of the schools with a growth status, 79.5 percent of elementary schools, 73.1 percent of middle schools and 69.5 percent of high schools met or exceeded academic growth goals, the release said.
Elementary and middle schools’ achievement scores are based only on test scores, the release said. These include end-of-grade reading and mathematics tests at the 3-8 grade levels; an end-of-grade science test at grades 5 and 8, and if applicable, end-of-course tests in Math I and Biology. The high school achievement score is based on student performance on Math I, English II and Biology end-of-course tests, and on the percentage of students who score 17 or above on The ACT (UNC System’s minimum composite score requirement), the percentage of students who achieve a Silver Certificate or better on the ACT WorkKeys, the percentage of students who successfully complete Math III, and the school’s four-year cohort graduation rate, according to the release.
Phipps said, however, it is difficult to place one letter grade on an entire school because there is so much that goes on in a school on a daily basis that will never show up in the letter grade. According to this scale, one-half of the schools evaluated in the county area at average and above, and there are above average results being achieved in every one of the county schools every day — some achieved on a student level that may not change an overall score or be reflected in formal test data, Phipps said.
“I hope that the public will consider this information along with other indicators of school success when determining, for themselves, how successful a school is,” Phipps said. “However, these grades also suggest that there is work to be done. Whether the letter grade is perceived as accurate or not, this information helps frame conversations within our school that can highlight areas of need. We will use this report card data as another performance indicator to help us in our efforts to continually improve. Continuous improvement requires us to consider the positive and negative outcomes revealed through data as we determine what needs to be done and how we will do it.”
The scores were released by the N.C. Department of Public Instruction for the first time ever, said Sarah Hodges, public information officer for BCS. Legislation passed during 2013 requires the inclusion of School Performance Grades as part of the North Carolina School Report Cards that also were released last week, according to the release.
There are a number of materials available online to help explain the School Performance Grades including a Background Brief and responses to Frequently Asked Questions. These documents can be accessed on the North Carolina Department of Public Instruction website – www.ncpublicschools.org – under Highlights.


